Data input
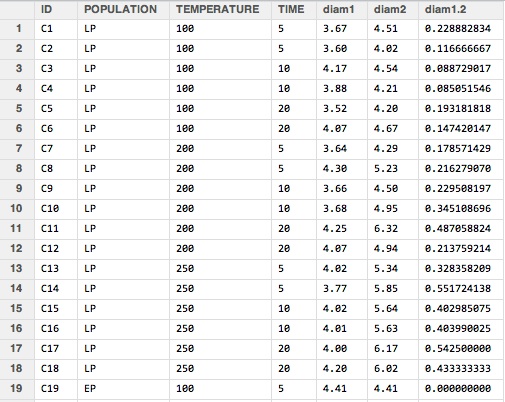
Table 1. Summary of descriptive statistics of cone opening after heating at three different temperatures and three times of exposure.
This is how data looks like in the database. Each row is a unit and variables are shown as columns. "Diam 1.2" is the variable used for opening.
This is how data looks like in the database. Each row is a unit and variables are shown as columns. "Diam 1.2" is the variable used for opening.
DATA
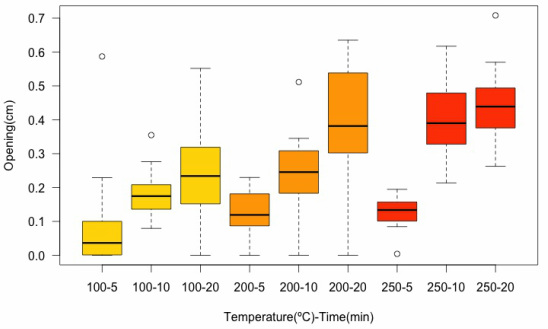
In this figure we can observe the data distribution of each treatment combination. The distribution is fairly normal with the exception of one of them (100ºC-5min and 200ºC). Outliers were identified and the belong to populations with huge variability in cone size and form. This data is preferred over transformed data (root square) because the later causes more outliers.
Fig.1 Boxplot for the cone opening after heating at three temperatures and three times of
exposure.
